Weekly Market Commentary | Week of December 16th, 2024
Week in Review…
Major U.S. equity indices showed mixed performance for the week, with notable divergence among the indexes.
- The S&P 500 down -0.64%
- The Dow Jones Industrial Average was down -1.82%
- The tech-heavy Nasdaq finished up +0.34%
- The 10-Year Treasury yield ended the week at 4.396%

The biggest market news last week was the release of November’s Consumer Price Index (CPI) data on Wednesday. While both headline and core CPI met month-over-month expectations, some market participants noted that headline inflation was slightly higher than the previous month (2.7% versus 2.6%). This marked the second consecutive month of year-over-year inflation increases. Market reaction was relatively muted, with the S&P 500 initially rising on Wednesday morning following the news, but it has since retreated.
While markets have expressed concern about rising inflation in recent months, this concern seems to be uneven. On Wednesday, the 10-year notes yield traded was lower than the month prior, suggesting that investors expect lower inflation in the future. This is despite short-term inflation remaining persistent. Long-term bondholders appear confident that the Federal Reserve will eventually achieve its 2% inflation target.
Last week brought important labor reports. Tuesday’s Nonfarm Productivity report met expectations at 2.2%, while Unit Labor Costs came in significantly lower than projected, at 0.8% instead of 1.9%. These reports suggest that future inflationary pressures from labor costs may be easing. However, Thursday’s reports hinted at potential labor market softening. Initial jobless claims were notably higher than expected, and continuing claims also rose slightly. These figures suggest some weaknesses emerging in the labor market. Investors will closely monitor future reports.
Spotlight

Santa Claus Rally
As the year ends, investors and financial media focus on the Santa Claus Rally, a seasonal rise in stock prices that has intrigued market watchers for decades. This article examines the data to determine whether this holiday trend leads to genuine, sustainable gains or if it’s merely a myth.
Historical Perspective
Yale Hirsch coined the term “Santa Claus Rally” in 1972, referring to the stock market’s tendency to rise during the last five trading days of December and the first two of January. Since 1950, this seven-day period has yielded positive returns for the S&P 500 about 80% of the time, with an average gain of 1.4%1. Surprisingly, the largest Santa Claus Rally occurred in 2008 during the Great Financial Crisis, with the S&P 500 surging 7.4%. Despite a difficult first quarter in 2009, the S&P 500 ended that year up 23%2.

Why It May Matter
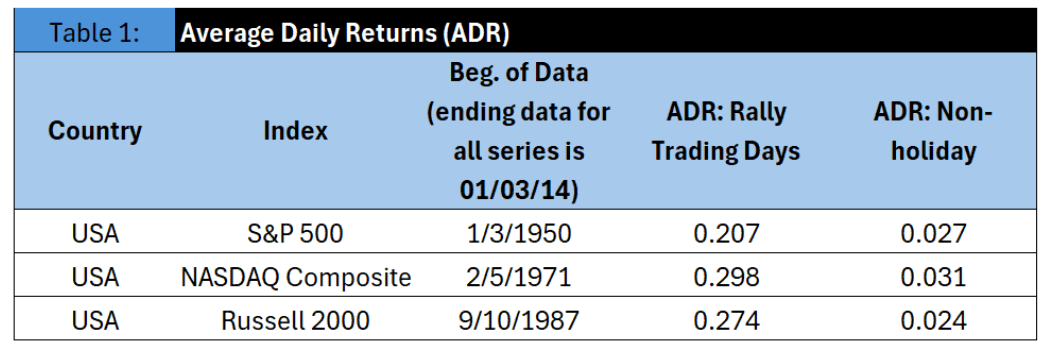
Investors are drawn to the Santa Claus rally for potential profits during a brief, specific period. More specifically, inferences from Table 1 confirm that this phenomenon may not be random:
- Returns during the Santa Claus Rally significantly differ from other trading days
- Average returns during this period are higher than non-holiday trading days
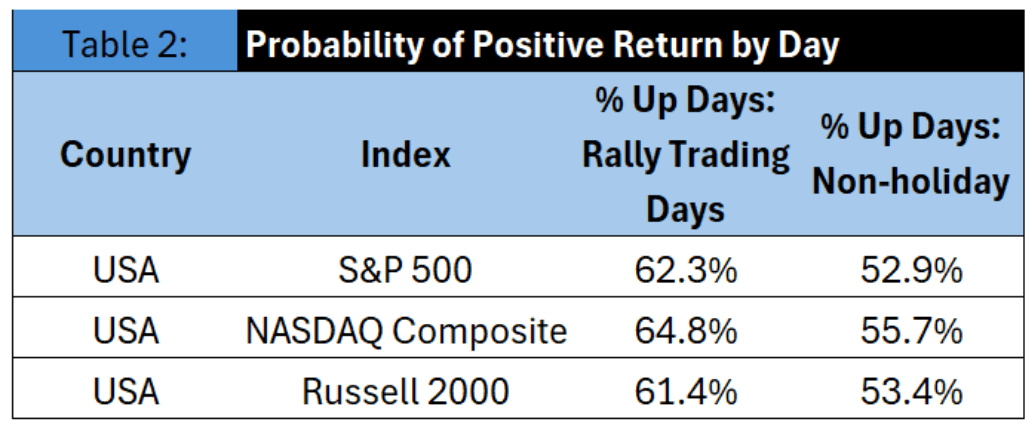
Additionally, the probability of positive returns is higher during the Santa Claus Rally compared to other trading days.
1 Dolan, Brian. “Santa Claus Rally: What It Is and Means for Investors.” Investopedia, December 15, 2023. Accessed December 12, 2024. https://www.investopedia.com/terms/s/santaclauseffect.asp#:~:text=A%20Santa%20Claus%20rally%20is,3
2 Bowman, Jeremy. “The Biggest Santa Claus Rally in History — What It Could Mean for Today.” The Motley Fool, December 24, 2023. https://www.fool.com/investing/2023/12/24/biggest-santa-claus-rally-history-what-could-mean/.

The significance of the difference between ADR Dec. &Jan. (and ADR: Dec) and ADR: Non-holiday at p<0.01.
Table 2 below expands upon this idea of higher expected returns and looks at how probable it is for a particular trading day to be positive.

Source: Journal of Financial Planning: March 20153
Inferences Published by Journal of Financial Planning
Based on empirical research published by Journal of Financial Planning in March 2015, investors experience higher returns and a greater probability of positive outcomes during the Santa Claus Rally compared to any other time of the year. The research revealed that investors generally view the Santa Claus Rally as a potential leading indicator for the following year’s market performance:
- Since 1994, it had accurately predicted the S&P 500’s direction in 22 out of 29 years, with the rally period’s gains or losses often preceding similar trends in the subsequent year
- However, the inclusion of January’s first two trading days in the rally definition, as established by Yale Hirsch in 1972, can create overlap with other indicators like the January Effect, potentially reducing its effectiveness
Potential Challenges
Capitalizing on the Santa Claus Rally presents challenges. While a broad market index allocation might yield attractive returns, identifying specific sectors or companies that could benefit the most may be challenging. For long-term investors, adjusting portfolios to exploit this short-term trend may be impractical and potentially costly. The opportunity cost of deviating from long-term allocations often outweighs potential gains from such seasonal fluctuations.
The Santa Claus Rally has shown mixed results in the post-Covid era from 2020 through 2024:
- 2020-2021: The market experienced a Santa Claus Rally, with the S&P 500 gaining during the traditional rally period
- 2021-2022: There was a Santa Claus Rally at the end of 2021, but 2022 was a challenging year for stocks, with the S&P 500 ending down approximately 18%
- 2022-2023: The Santa Claus Rally did not occur, breaking a seven-year streak of year-end rallies
- 2023-2024: Despite the absence of a Santa Claus Rally the previous year, the stock market significantly outperformed in 2024. The S&P 500 rose by roughly 28% through the first week of December, while the Dow Jones Industrial Average increased by about 19%, and the Nasdaq gained nearly 35%.
3 Financial Planning Association. “Yes, Virginia, There Is a Santa Claus Rally: Statistical Evidence Supports Higher Returns Globally,”
While the Santa Claus Rally may be more than a myth, the costs of exploiting this market trend may outweigh its benefits for most investors.
Week Ahead…

Next week, investors will undoubtedly focus on the Federal Reserve’s upcoming decision regarding interest rates. Despite higher-than-expected inflation data released this week, markets remained relatively calm, suggesting that inflation may no longer dominate investor concerns. While the decline in inflation has stalled, it appears unlikely to deter the Fed from proceeding with its anticipated 25-basis-point (bps) rate cut at its December meeting next Wednesday. Instead, the slowdown in the job market has emerged as a more critical factor shaping market expectations for monetary policy decisions. Futures markets, as tracked by the CME Group, are pricing in a 95% probability of 25 bps cut.
Before the Fed meeting, investors will also turn their attention to the Purchasing Managers’ Index (PMI) data. This report, set for release early in the week, provides a snapshot of business activity across the manufacturing and services sectors. However, unless the PMI shows a significant and unexpected increase, it is unlikely to shift the prevailing market outlook or the Fed’s course of action.
Housing starts and building permits will be out on Wednesday before the Fed. Initial jobless claims, Philadelphia Fed Index, final and existing home sales will be published on Thursday. Also, the markets will digest the third-quarter gross domestic product (GDP) numbers on Thursday. These figures will shed light on the strength of the U.S. economy heading into year-end and could influence investor sentiment. A stronger-than-expected GDP reading might raise concerns about the potential for prolonged monetary tightening, while a weaker reading could reinforce expectations of further rate cuts in 2025. On Friday, we will receive the Personal Consumption Expenditures (PCE) data, which is the Federal Reserve’s preferred inflation measure. It will be interesting to observe how the market reacts to any changes in the PCE, especially considering the subdued response to last week’s CPI report. Together, these events will shape the market’s outlook on economic growth, inflation trends, and the Fed’s policy trajectory as the year comes to a close.
This content was developed by Cambridge from sources believed to be reliable. This content is provided for informational purposes only and should not be construed or acted upon as individualized investment advice. It should not be considered a recommendation or solicitation. Information is subject to change. Any forward-looking statements are based on assumptions, may not materialize, and are subject to revision without notice. The information in this material is not intended as tax or legal advice.
Investing involves risk. Depending on the different types of investments there may be varying degrees of risk. Socially responsible investing does not guarantee any amount of success. Clients and prospective clients should be prepared to bear investment loss including loss of original principal. Indices mentioned are unmanaged and cannot be invested into directly. Past performance is not a guarantee of future results.
The Dow Jones Industrial Average (DJIA) is a price-weighted index composed of 30 widely traded blue-chip U.S. common stocks. The S&P 500 is a market-cap weighted index composed of the common stocks of 500 leading companies in leading industries of the U.S. economy. The NASDAQ Composite Index is a market-value weighted index of all common stocks listed on the NASDAQ stock exchange.
