Weekly Market Commentary
April 7th, 2025
Week in Review…
Market indexes declined last week as investors adjusted their future expectations in response to increasing global trade tensions.
- The S&P 500 declined -9.08%
- The Dow Jones Industrial Average dropped -7.86%
- The tech-heavy Nasdaq fell -9.77%
- The 10-Year Treasury yield closed at 3.99%
Last week, markets were transfixed by the sweeping tariffs presented by U.S. President Trump and the idea of an ever-escalating trade war. However, in the background, several key economic reports were released that might have been overlooked. Here is a summary of the important economic reports from last week.
The labor market data was significant. February’s Job Openings and Labor Turnover Survey (JOLTS) report showed fewer job openings than forecast, confirming a softening labor market. On Wednesday, the ADP Nonfarm Payrolls report for March came in higher than expected, adding 155,000 jobs compared to the expected 118,000, contrasting February’s underperformance. Friday’s Bureau of Labor Statistics Nonfarm Payrolls report confirmed March’s labor market strength, with employment changes beating forecasts, adding 225,000 jobs compared to the expected 137,000. The Private Nonfarm Payrolls report also exceeded expectations at 209,000. The Unemployment Rate for March ticked higher to 4.2%. Weekly employment data provided mixed signals, with continuing jobless claims higher than expected and initial jobless claims lower.
Survey data from the Services and Manufacturing industries was also notable. S&P Global revised both the Manufacturing and Services Purchasing Managers’ Indexes (PMI) upward, providing optimism. However, ISM Manufacturing and Services PMI data disappointed. The ISM survey, which focuses on larger companies and is based on data from purchasing and supply executives, indicated conflicting inflationary pressures. Manufacturing prices rose, while services prices fell.
Overall, last week’s data highlighted the complexity of the economy. The mixed signals from various reports suggest that market participants, including the Federal Reserve, will need to carefully navigate the ever-changing economic landscape. The contrasting data points underscore the importance of a nuanced approach to economic analysis and policy-making.
Spotlight

The Underrated Power of Mid-Cap Stocks: Growth, Returns, and Diversification
In the dynamic world of investing, mid-cap stocks offer a compelling blend of growth potential and relative stability, often overlooked despite their strong historical performance and diversification benefits. This article explores the key advantages of mid-cap investing, highlighting their outperformance, attractive risk-adjusted returns, growth potential, and diversification benefits, while also addressing their under-allocation and inherent risks.
A History of Outperformance and Enhanced Risk-Adjusted Returns
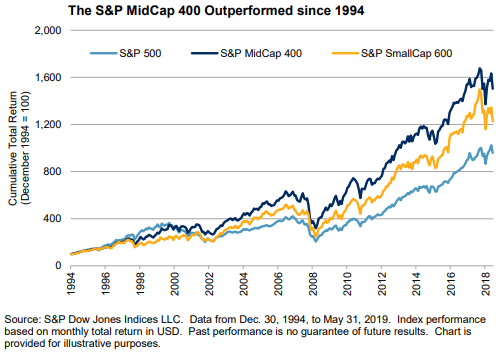
Historically, mid-cap stocks have demonstrated a strong track record of outperforming both large and small-cap equities. MSCI data shows the MSCI World Mid Cap Index surpassed both larger and smaller companies between October 2008 and October 2012. This trend is further supported by SPDR’s analysis of the S&P MidCap 400 between beginning in 1994, which reveals an average annualized excess return of 1.12%. Specifically, the S&P MidCap 400 has outperformed the S&P 500 (large caps) by 2.03% and the S&P SmallCap 600 by 0.92% annually since December 1994 (through 2018). This long-term data underscores mid-caps’ potential for delivering strong returns relative to the risk taken, often exhibiting enhanced risk-adjusted returns.
Source: The S&P MidCap 400: Outperformance and Potential Applications
(click image to expand)
However, recent performance has seen a shift, with the S&P 500 outperforming both small and mid-caps in the last five years. This outperformance in large-cap stocks was particularly pronounced after March 2020, coinciding with the Federal Reserve’s interest rate cuts that significantly benefited high-growth technology stocks, a large component of the S&P 500. Despite this recent divergence, the longer-term historical data still highlights the compelling risk-adjusted return potential of mid-cap investments over extended periods.
The Sweet Spot: Balancing Growth and Stability
Mid-cap stocks occupy a unique middle ground, offering a balance between the high growth potential of small caps and the relative stability of large caps. MSCI notes that mid-caps provide higher growth potential than large caps with more stability than small caps. These companies are often in a significant expansion phase, possessing the agility to pursue growth while having established a degree of operational maturity. SPDR supports this, describing mid-caps as nimble with high growth potential alongside more established management. This blend positions mid-caps as attractive for investors seeking growth without the higher volatility often associated with smaller, less proven entities.
An Overlooked Opportunity: The Under-allocation of Mid-Caps
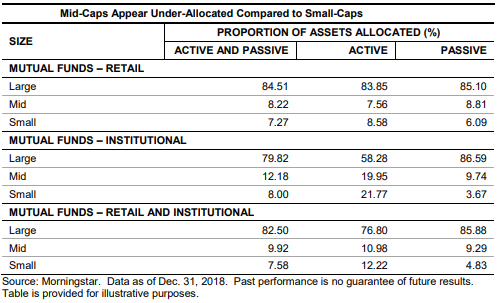
Despite their historical performance and growth profile, mid-cap stocks are frequently under-allocated in investment portfolios compared to small-caps. Data indicates similar allocation proportions despite mid-caps representing roughly twice the market capitalization of small-caps. This under-allocation, particularly in active funds, suggests a potentially overlooked segment offering opportunities for investors.
Source: The S&P MidCap 400: Outperformance and Potential Applications
(click image to expand)
Enhancing Portfolio Diversification
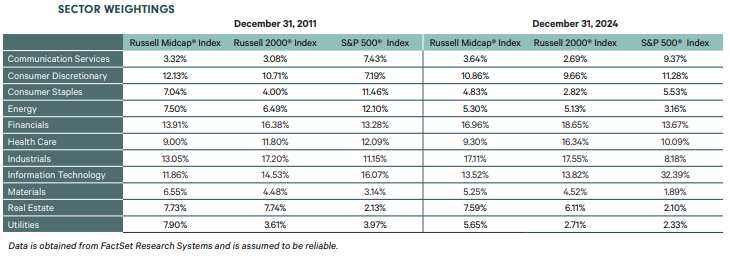
Incorporating mid-cap stocks into an investment portfolio can significantly enhance diversification and potentially improve overall risk-adjusted returns. MSCI’s research indicates that including mid-caps can lead to superior risk-adjusted performance by providing exposure to a distinct market segment. SPDR’s analysis supports this, demonstrating that mid-caps can improve returns without a corresponding increase in volatility, resulting in better Sharpe and Sortino ratios compared to small caps. The inclusion of the S&P MidCap 400 in a multi-asset portfolio has been shown to offer better diversification benefits. The chart below indicates that S&P MidCap 400 currently provides a greater level of diversification out of the technology sector.
Source: Kayne Anderson Rudnick: The Case for Mid-Caps
(click image to expand)
Potential Downside Risks and Volatility
While offering compelling benefits, mid-cap stocks also carry inherent risks. Compared to large-caps, they often have fewer financial resources, making them more vulnerable during economic downturns. Saxo Bank notes their generally higher volatility compared to larger companies due to their size and less established markets. They can also have a narrower focus, increasing sector-specific risks and tend to have less analyst coverage. Investors should be aware of this potentially higher volatility compared to large-caps.
Conclusion
Mid-cap stocks offer a compelling combination of historical outperformance, attractive risk-adjusted returns, significant growth potential, and valuable diversification benefits. While acknowledging recent large-cap strength and the inherent risks of the asset class, the evidence suggests that a strategic allocation to mid-caps can be a valuable component of a well-rounded investment portfolio, potentially enhancing long-term growth and overall performance.
Russell 2000® Index: The Russell 2000® Index measures the performance of the 2,000 smallest companies in the Russell 3000® Index, representing the small-cap segment of the U.S. equity market. It is widely regarded as a bellwether for the U.S. economy due to its focus on smaller companies. The index is managed by FTSE Russell and is designed to provide a comprehensive and unbiased barometer for small-cap stocks.
S&P SmallCap 600® Index: The S&P SmallCap 600® Index seeks to measure the small-cap segment of the U.S. equity market. It includes 600 companies that meet specific inclusion criteria to ensure liquidity and financial viability. The index is designed to track companies with market capitalizations ranging from $850 million to $3.7 billion, providing a benchmark for small-sized companies.
S&P MidCap 400™ Index: The S&P MidCap 400™ Index measures the performance of 400 mid-sized companies in the U.S. equity market. It is a market-capitalization-weighted index that reflects the distinctive risk and return characteristics of mid-cap stocks. The index is designed to provide investors with a benchmark for mid-sized companies, balancing growth potential and stability.
Russell Midcap Index: An index that measures the performance of the mid-cap segment of the U.S. equity market. It includes approximately 800 of the smallest companies in the Russell 1000 Index, representing about 27% of the total market capitalization of the Russell 1000. The index is designed to provide a comprehensive and unbiased barometer for the mid-cap sector, balancing growth potential and stability. It is reconstituted annually to ensure it accurately reflects the mid-cap market segment.
Works Referenced:
Bartolini, Matthew J and SPDR Americas Research. “Mid Caps Can Make a Positive Difference in Performance.” SPDR Americas Research, n.d.
Bellucci, Louis, Hamish Preston, Aye M. Soe, and S&P Dow Jones Indices LLC. “The S&P MidCap 400: Outperformance and Potential Applications.” Report. The S&P MidCap 400: Outperformance & Potential Applications, June 2019. https://www.spglobal.com/spdji/en/documents/research/research-sp-midcap-400-outperformance-and-potential-applications.pdf.
Kayne Anderson Rudnick Investment Management. “The Case for Mid-Caps,” 2024.
Ruban, Oleg, Zoltán Nagy, Jose Menchero, and MSCI Applied Research. “Global Market Report: The Mid Cap Effect.” Report. Global Market Report, December 2012.
Saxo Bank A/S (Headquarters). “Mid-cap Stocks: What They Are and Why You Should Care,” n.d. https://www.home.saxo/learn/guides/equities/mid-cap-stocks-what-they-are-and-why-you-should-care.
Week Ahead…

This week is packed with significant economic releases. On Monday, the Federal Reserve will release the monthly change in the total value of outstanding consumer credit, providing insights into consumer borrowing trends. Tuesday will see the American Petroleum Institute reporting inventory levels of crude oil, petrol, and distillate, which are crucial indicators for the energy market. The Federal Open Market Committee (FOMC) meeting minutes will be published on Wednesday, offering a detailed account of the discussions and decisions made during the latest policy meeting. Thursday brings the initial jobless claims and Core Consumer Price Index (CPI) data, both of which are key indicators of the labor market and inflation trends. Finally, on Friday, the Core Producer Price Index (PPI) and Michigan Consumer Expectations will be released, shedding light on producer inflation and consumer sentiment, respectively. This array of data will provide a comprehensive view of the current economic landscape.
This content was developed by Cambridge from sources believed to be reliable. This content is provided for informational purposes only and should not be construed or acted upon as individualized investment advice. It should not be considered a recommendation or solicitation. Information is subject to change. Any forward-looking statements are based on assumptions, may not materialize, and are subject to revision without notice. The information in this material is not intended as tax or legal advice.
Investing involves risk. Depending on the different types of investments there may be varying degrees of risk. Socially responsible investing does not guarantee any amount of success. Clients and prospective clients should be prepared to bear investment loss including loss of original principal. Indices mentioned are unmanaged and cannot be invested into directly. Past performance is not a guarantee of future results.
The Dow Jones Industrial Average (DJIA) is a price-weighted index composed of 30 widely traded blue-chip U.S. common stocks. The S&P 500 is a market-cap weighted index composed of the common stocks of 500 leading companies in leading industries of the U.S. economy. The NASDAQ Composite Index is a market-value weighted index of all common stocks listed on the NASDAQ stock exchange.
Securities offered through Cambridge Investment Research, Inc., a broker-dealer, member FINRA/SIPC, and investment advisory services offered through Cambridge Investment Research Advisors, Inc., a Registered Investment Adviser. Both are wholly-owned subsidiaries of Cambridge Investment Group, Inc. V.CIR.0425-1380


